> kairox blaze
The Bilateral ROI Hypothesis: Right Structure, Wrong Sample Size
The Bundesliga BTTS model finds positive NO edge in every validation fold. The bootstrap confidence interval is 77 percentage points wide. Both of these things are true, and together they define exactly what kind of problem this is.
A BTTS binary classifier has two prediction directions: YES (both teams score) and NO (at least one team fails to score). Most deployed models find edge on one side or neither. Finding positive ROI on both sides simultaneously, what this investigation calls bilateral ROI, would require the model to be well-calibrated in both directions and the market to misprice both outcomes. That is a stronger claim than usual, and it demands stronger evidence.
The KairoX Blaze Bundesliga model (BU v3, V3 Poisson feature set, 200 Optuna trials) records +12.08% headline ROI on its most recent validation season. That figure is from one fold. The question investigated here is whether the bilateral signal holds across the full walk-forward history, and whether there is statistical basis for treating it as a deployment signal rather than a fold-level coincidence.
The short answer: the signal does not pass the bootstrap test. The longer answer is why that failure is informative rather than dismissive.
What the Three-Fold History Shows
Across three walk-forward validation seasons (23-24, 24-25, 25-26), bilateral ROI first appears at the 62.5% confidence threshold with 22 NO bets. At the more operationally relevant 60% threshold, YES ROI is +3.32% and NO ROI is -3.23% across all folds combined. The fold-level breakdown is where the picture gets structurally interesting.
| Fold | Season | N YES | ROI YES | N NO | ROI NO |
|---|---|---|---|---|---|
| Fold 0 | 23-24 | 85 | -0.53% | 23 | -36.13% |
| Fold 1 | 24-25 | 113 | -4.24% | 10 | +16.30% |
| Fold 2 | 25-26 | 85 | +17.21% | 19 | +26.32% |
Fold-level ROI at the 60% confidence threshold. Bilateral ROI holds only in fold 2. Fold 0 produced strongly negative NO ROI on 23 bets.
Fold 0 is the problem. 23 high-confidence NO bets in the 23-24 season, 13 of which lost, producing -36.1% ROI on that direction. This single fold pulls the three-fold aggregate into negative territory for NO bets. Fold 1 and fold 2 are both positive on NO, with fold 2 showing bilateral ROI at +17.2% YES and +26.3% NO simultaneously.
The natural reading is that fold 2 is noise. But before accepting that, it is worth looking at what the model was doing structurally rather than just what it returned.
Edge Per Bet Is the More Honest Signal
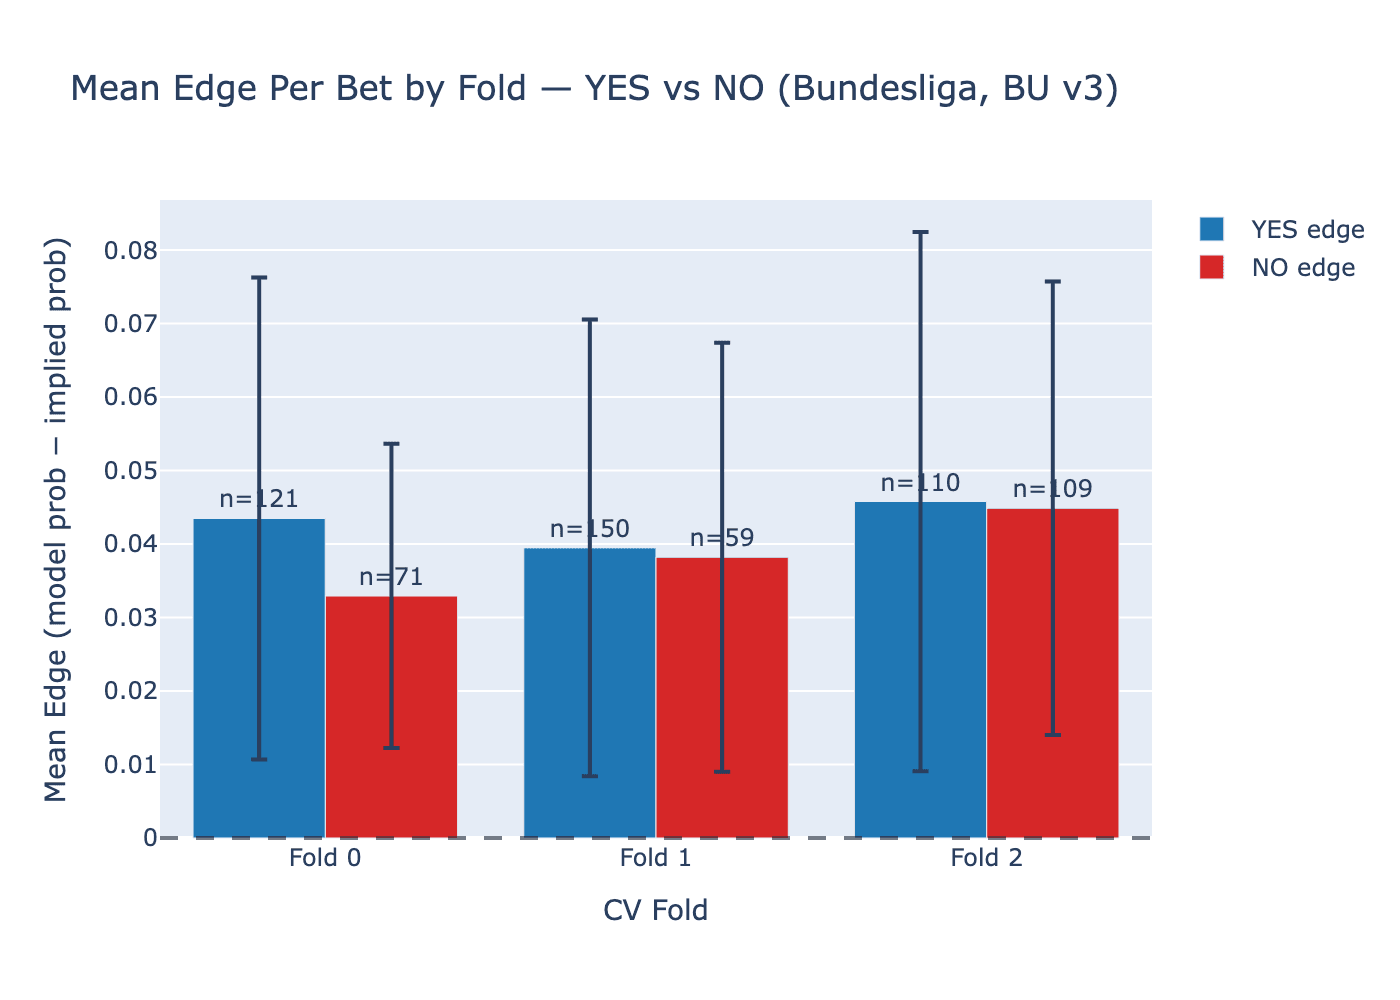
ROI computed on a small number of bets is dominated by variance. A cleaner signal is the mean edge per value bet: the average difference between the model's predicted probability and the market's implied probability, measured only on bets where the model has positive expected value. Unlike realized ROI, this metric is not affected by which specific matches happened to result in YES or NO. It measures whether the model systematically identifies matches where the market is mispriced in the NO direction.
| Fold | Season | N NO value bets | Mean NO edge | N YES value bets | Mean YES edge |
|---|---|---|---|---|---|
| Fold 0 | 23-24 | 71 | 0.033 ± 0.021 | 121 | 0.044 ± 0.033 |
| Fold 1 | 24-25 | 59 | 0.038 ± 0.029 | 150 | 0.040 ± 0.031 |
| Fold 2 | 25-26 | 109 | 0.045 ± 0.031 | 110 | 0.046 ± 0.037 |
Mean edge per value bet across all confidence levels. The NO edge is positive and increasing across all three folds, including fold 0 where realized NO ROI was -36%.
The NO edge is positive in every fold (3.3%, 3.8%, 4.5%) and trending upward. In fold 0, where realized NO ROI was -36.1%, the model was still identifying NO bets with a mean 3.3% edge over the market. The losses came from the outcomes, not from the selections. A model that places 23 bets with positive expected value and loses 13 is not a model that got the mechanism wrong. It is a model that experienced variance on a small sample.
This is the distinction the bootstrap makes concrete.
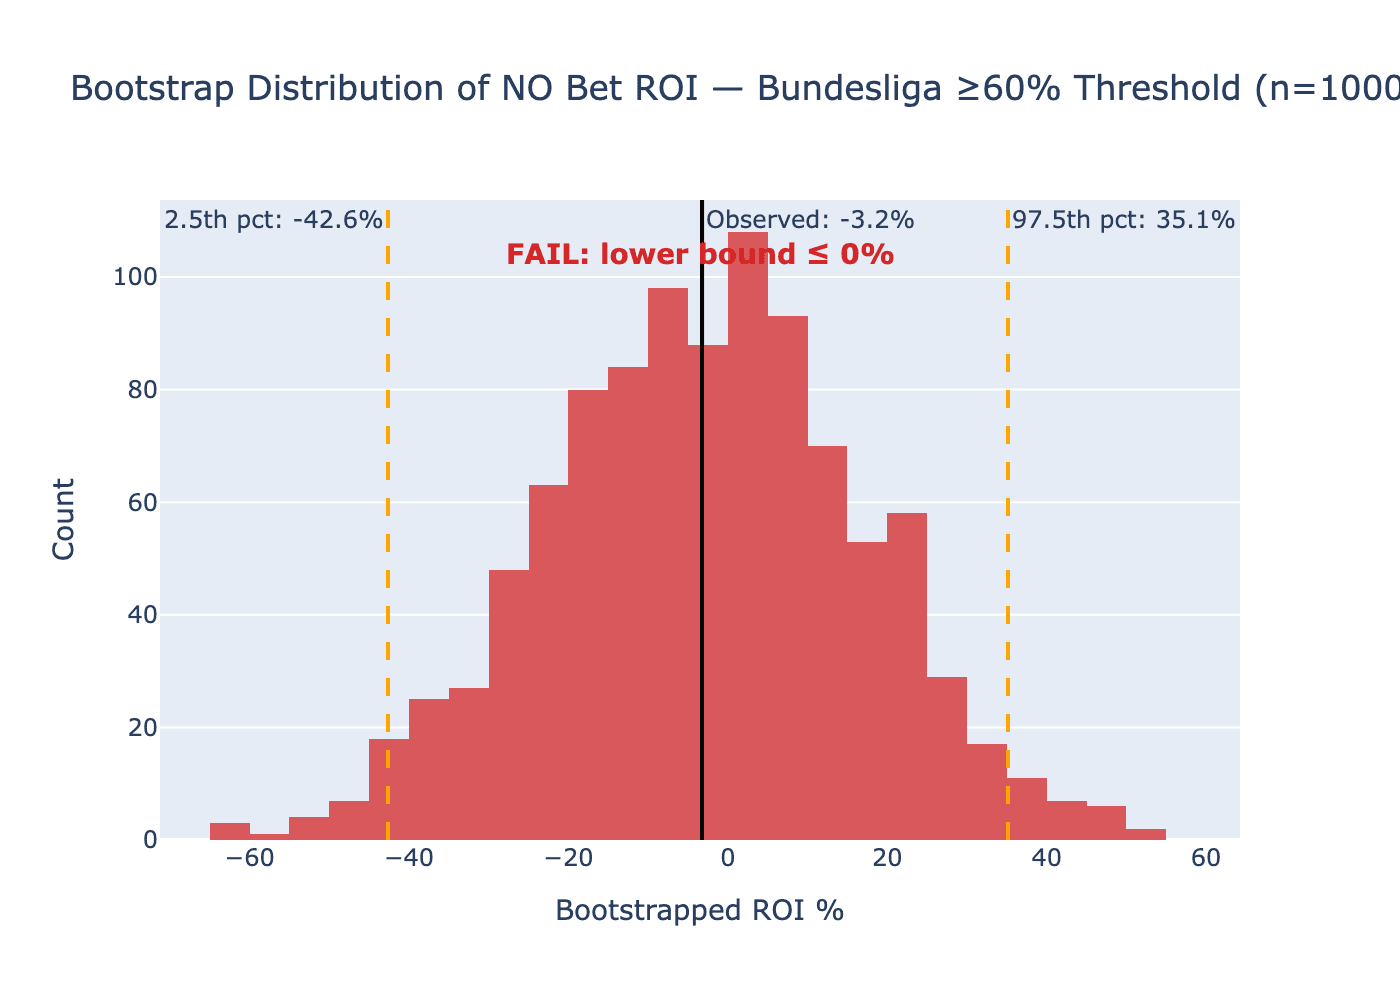
The Bootstrap Result
With 52 NO bets at the 60% confidence threshold across three folds, the bootstrap 95% confidence interval for NO ROI is (-42.64%, +35.15%). The observed NO ROI sits at -3.23%. The CI spans 77.8 percentage points. The YES direction, with 283 bets at the same threshold, has a much narrower interval: (-5.90%, +12.79%), also straddling zero.
A 77-point CI does not tell you the bilateral hypothesis is wrong. It tells you that with 52 observations, you cannot tell anything. The observed -3.23% is consistent with a true underlying ROI anywhere from strongly negative to meaningfully positive. This is the correct statistical conclusion and it is also the deployment conclusion: do not bet NO on this model until the sample is large enough to distinguish signal from noise.
The Structural Conditions Are Present
Three structural observations suggest the bilateral hypothesis is worth continuing to test rather than discarding.
First, the model's NO zone is precise. It assigns P(NO) above 0.45 to only 16.6% of Bundesliga matches. In those matches, the actual NO rate is 50.7% against average implied odds of 42.9%, a 7.8 percentage point structural edge. The model is not broadly uncertain about BTTS; it makes targeted NO calls in a narrow set of matches and is accurate more often than the market expects. La Liga by contrast assigns P(NO) above 0.45 to 82.4% of matches with an actual NO rate of only 46.2% in that zone. The contrast illustrates why Bundesliga is structurally more likely to support bilateral ROI: the model is discriminating rather than uncertain.
Second, the Bundesliga model is well-calibrated in both directions (ECE=0.018, mean absolute deviation 0.031 for both YES and NO). Bilateral ROI requires bilateral calibration. A model that prices NO accurately is a necessary precondition for finding NO edge. La Liga's poorly calibrated model (mean absolute deviation 0.075) is structurally incapable of sustained bilateral edge even if the market mispricing existed.
Third, the bilateral signal persists independently of the feature set. Running the same test on BU v4 (V4 venue tendency features, 37 features, a different architectural approach to Blaze) finds bilateral ROI at the 60% threshold with positive mean NO edge across all three folds (0.029, 0.040, 0.042). The v4 bootstrap also fails, but the fact that two structurally different models both independently identify NO edge in the same market makes a feature-specific artifact considerably less likely.
The Data Requirement
A power analysis for the NO direction (one-sided proportions z-test, H0: win rate equals implied NO probability of 34.8%, alpha=0.05, 80% target power) puts the required sample at roughly 220 high-confidence NO bets for a medium-edge scenario (+8pp above implied). At approximately 17 qualifying NO bets per Bundesliga season at the 60% threshold, that requires around 9 more seasons of data. That is not a path to confirmation through historical back-testing. It requires live deployment with a small flat stake to accumulate the sample.
The vig-adjusted picture is relevant here too. The raw bilateral signal survives vig adjustment (mean overround 1.052, approximately 5.2% headwind per bet) but only at the 62.5% threshold, not 60%. The model needs a larger edge per bet than the raw odds suggest to generate positive expected value after vig. At 62.5%, with 22 NO bets across three folds, the sample problem is even more acute.
What remains open is whether the bilateral hypothesis holds under live conditions or whether it is a walk-forward artifact from three specific seasons of Bundesliga data. The structural evidence says it is worth testing. The statistical evidence says it has not been tested yet.