> kairox tempo
The Model Senses Draws. Then Buries Them.
KairoX Tempo assigns P(draw) above 0.25 to 60% of the draws it misses. The signal is there. The decision boundary discards it.
This log uses EXP-006 (V5, ECE=0.0193), the best-calibrated KairoX Tempo artifact, across 1,140 OOF predictions from three La Liga validation seasons (23-24, 24-25, 25-26). The question: are draws the model gets right structurally different from draws it misses, or is the draw class just genuinely unpredictable?
Sample size caveat
The model predicted draw as the most likely outcome only 31 times across 1,140 matches. Seven of those were correct. That gives a true positive sample of n=7, which is too small for robust statistical claims on its own. The feature comparison results (Q2) should be read as directional rather than definitive. The underpricing finding (Q5, Q6) is on a much larger base: 290 missed draws and 668 high-P(draw) matches, which is where the confidence is.
How Rarely the Model Commits
The base draw rate in the dataset is 26.1%. The model predicts draw as the most likely outcome in 2.7% of matches. When it does, it is correct 22.6% of the time. That is a precision figure that barely clears the threshold of usefulness, and a recall figure (2.4%) that makes draw betting operationally irrelevant with this artifact.
| Category | Count | % of OOF |
|---|---|---|
| Actual draws | 297 | 26.1% |
| True positive draws (predicted D, actual D) | 7 | 0.6% |
| False negative draws (actual D, predicted H or A) | 290 | 25.4% |
| False positive draws (predicted D, actual H or A) | 24 | 2.1% |
Draw prediction breakdown across 1,140 OOF matches. Precision: 22.6%. Recall: 2.4%.
The natural reading is that draws are hard to predict, which is true, but not the full story. A 2.4% recall means the model is not finding draws it cannot find. It means the model is actively not predicting draws it has reasonable probability mass on.
Underpricing, Not Ignorance
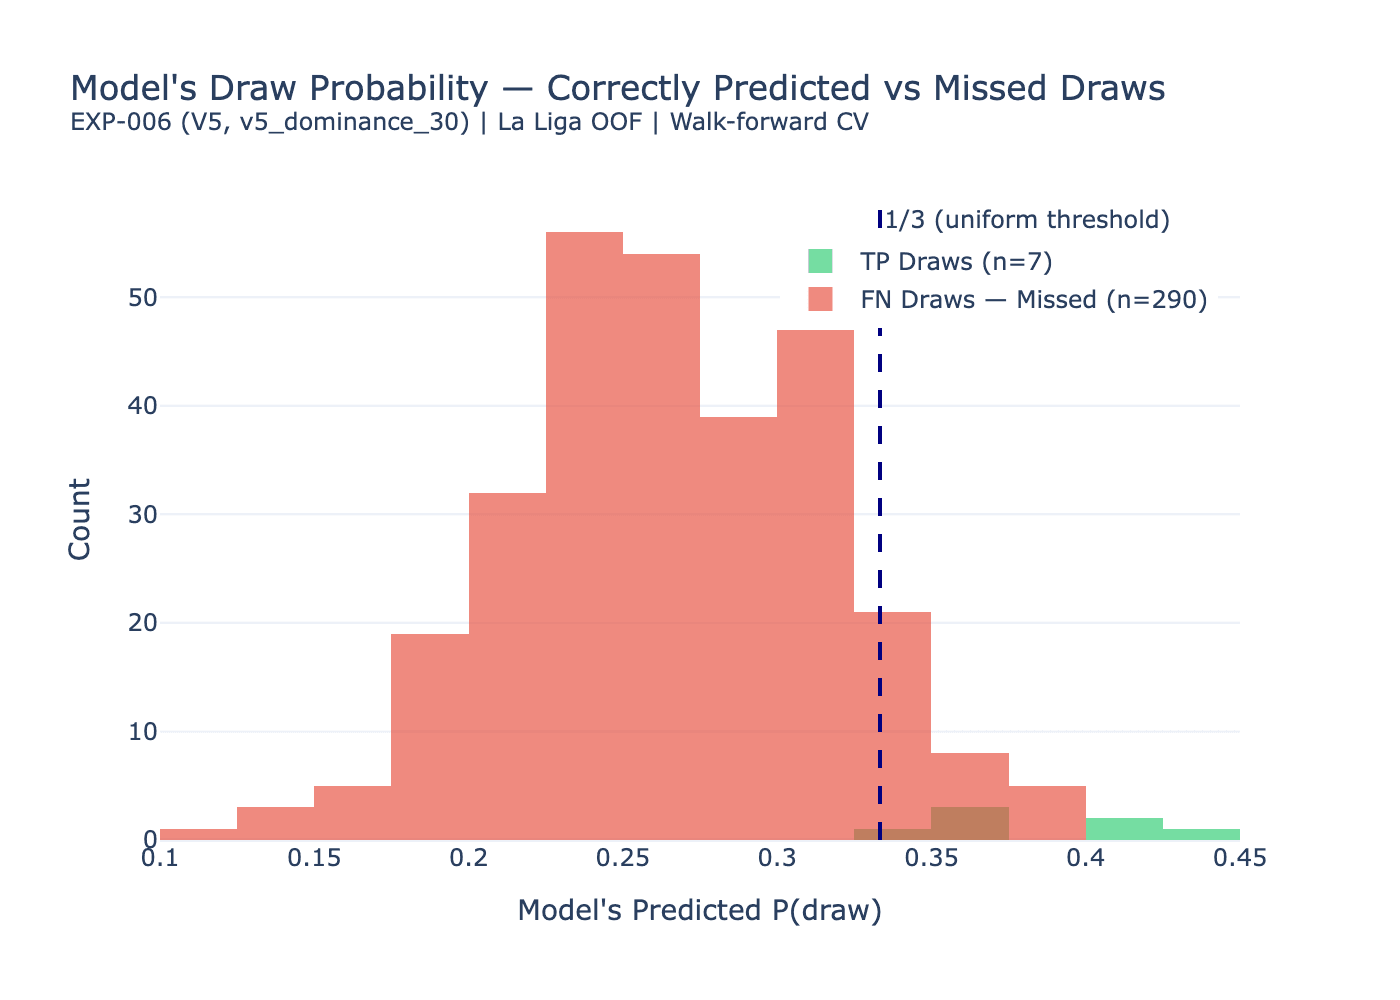
Among the 290 missed draws, the mean P(draw) assigned by the model is 0.266. For the 7 correctly predicted draws, it is 0.388. That gap is significant (Mann-Whitney p less than 0.001, Cohen's d=2.417), but the more important number is this: 174 out of 290 missed draws, 60%, had P(draw) above 0.25. The model was not blind to those draws. It placed meaningful probability on them and then selected H or A anyway.
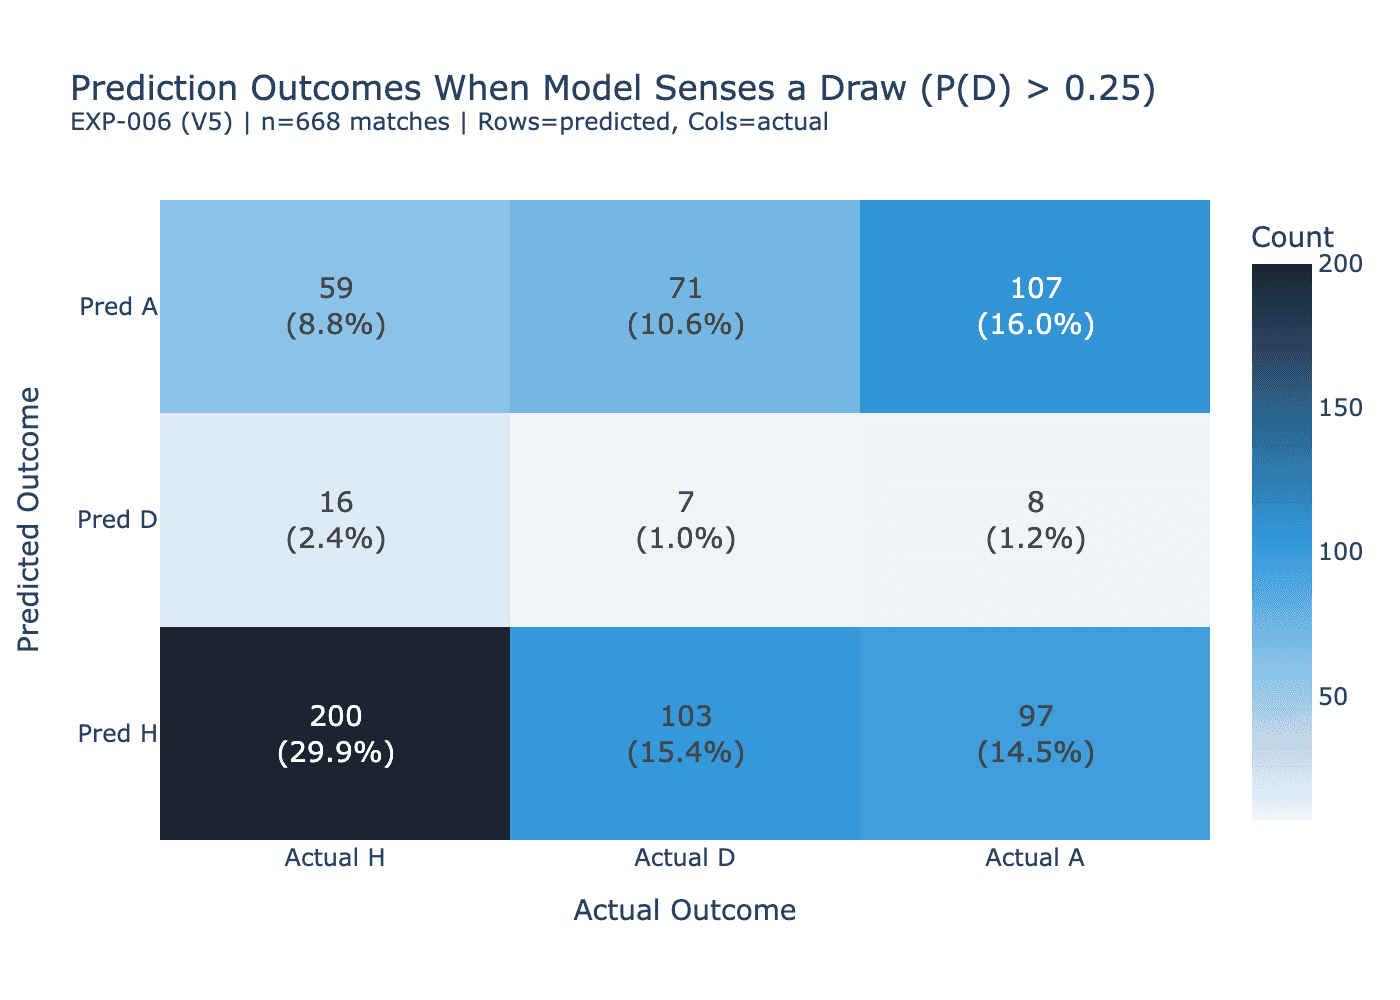
Looking at all 668 matches where the model assigned P(draw) above 0.25, the actual draw rate is 27.1%, essentially identical to the full dataset base rate of 26.1%. The model's elevated draw probability is not predictive of draws in aggregate. But within that subset, the model chose to predict draw only 31 times. For the remaining 637 matches, it assigned above-threshold draw probability and still predicted H or A.
What Distinguishes the Draws the Model Gets Right
With the n=7 caveat stated upfront, the feature comparison between correctly predicted and missed draws does produce two results that clear both the statistical and effect size thresholds.
| Feature | TP median | FN median | p-value | Cohen's d |
|---|---|---|---|---|
| Home xG_op at Home (roll5) | 0.478 | 0.926 | 0.0026 | 1.082 |
| Away xG_op Away (roll5) | 0.506 | 0.792 | 0.0361 | 0.770 |
| Passes Acc delta (roll10) | -103.75 | -9.50 | 0.062 (ns) | 0.639 |
| Points Gap | -56.0 | -8.5 | 0.249 (ns) | 0.339 |
| xG Open Play delta (roll10) | -0.091 | -0.077 | 0.706 (ns) | 0.106 |
Feature comparison: correctly predicted vs missed draws. Only venue-specific xG features clear p<0.05 and Cohen's d>0.4 simultaneously.
The two significant features are both venue-specific xG measures. Correctly predicted draws happen in matches where the home team's open-play xG at home (roll5) is low (median 0.478) and the away team's open-play xG away from home (roll5) is also low (median 0.506). Missed draws happen in matches where both figures are higher: 0.926 and 0.792 respectively.
The interpretation is that the draws the model correctly identifies are tactically constrained matches where neither team is generating meaningful xG in their home environment. Low attacking output on both sides creates a kind of parity that the model can detect. The draws it misses are in higher-xG environments where both teams are creating chances but the match ends level anyway, the kind of draw that results from finishing variance rather than structural balance.
That second type of draw is plausibly undetectable from pre-match features. No feature set will reliably predict that a match with xG 1.8 vs 1.6 ends 0-0 rather than 2-1. The question the data cannot yet answer is whether the first type, the structurally constrained draw, can be recovered with better feature representation or a different decision boundary.
An Open Question on the Decision Boundary
The finding points to a representation gap rather than a signal gap. The model has draw probability mass in the right places. The issue is that cross-entropy loss, optimised globally across all three classes, does not penalise missed draws heavily enough to move the decision boundary. A draw accounts for 26% of outcomes but produces only modest loss when incorrectly classified as H or A, because H and A together form the majority. The model learns to avoid the draw prediction unless the evidence is overwhelming.
What is not clear is whether this is fixable at the loss function level, at the threshold level, or not at all for the high-xG draw subset. A draw-aware loss that penalises FN draws more heavily might shift the boundary, but it could also introduce draw over-prediction that destroys the H and A ROI the model currently has. That tradeoff has not been tested, and the answer is not obvious from the data here.